Digital SAT guide

Understand the Digital SAT before you study for it

The Digital SAT is short enough to reward precision and adaptive enough to punish random studying. Learn the structure first, diagnose the skills costing points, then practice those skills under the clock.

Jump to Desmos strategies
testing time
2h 14m
scored + pretest questions
98
adaptive sections
2

The test is a sequence

See the whole route before you solve the first question.

Reading and Writing and Math each contain two modules. Your first-module performance helps determine whether your second module is the higher- or lower-difficulty route. Routing affects the score range available, so Module 1 accuracy matters as much as late-test stamina.

  • Reading and Writing: 54 questions across two 32-minute modules
  • Math: 44 questions across two 35-minute modules
  • A 10-minute break separates the two sections

134 minutes, mapped

See where every minute goes before the clock starts.

Reading and Writing54 questions · 64 minutes
BreakReset · 10 minutes
Math44 questions · 70 minutes

Two sections, different decisions

Prepare for the move, not the label.

The test changes subjects, but the preparation rule stays steady: know the task, choose a repeatable method, and practice it at the right pace.

54 questions

What Reading and Writing tests

Short passages replace the long reading sets from the paper SAT. Each item focuses on one move: evidence, inference, words in context, text structure, rhetorical synthesis, transitions, or Standard English conventions.

  • Information and Ideas
  • Craft and Structure
  • Expression of Ideas
  • Standard English Conventions
44 questions

What Math tests

The Math section emphasizes algebraic reasoning, advanced math, data analysis, and selected geometry and trigonometry. Calculator use is allowed throughout, but efficient setup still beats typing every step into a tool.

  • Algebra
  • Advanced Math
  • Problem-Solving and Data Analysis
  • Geometry and Trigonometry

A repeatable route

A study sequence that keeps the test connected

  1. 01

    Take a diagnostic

    Establish a realistic starting band and identify the two or three weakest domains.

  2. 02

    Repair one skill at a time

    Learn the rule, do a short untimed set, then repeat under timing.

  3. 03

    Rehearse full modules

    Use adaptive practice to test routing, endurance, pacing, and recovery after a miss.

  4. 04

    Review by reason

    Label each miss: knowledge gap, setup error, trap answer, or timing decision.

Keep exploring

Take the next step from here.

The guide gives you the route. These tools help you choose a date, build practice, and turn both into a week you can use.
Desmos on the Digital SAT

Know what to enter. Know what to read.

Bluebook includes Desmos graphing and scientific calculators throughout Math. Use the graphing option for intersections, roots, and models; use direct arithmetic when it is quicker. A graph helps with the calculation, but you still decide what the answer means.

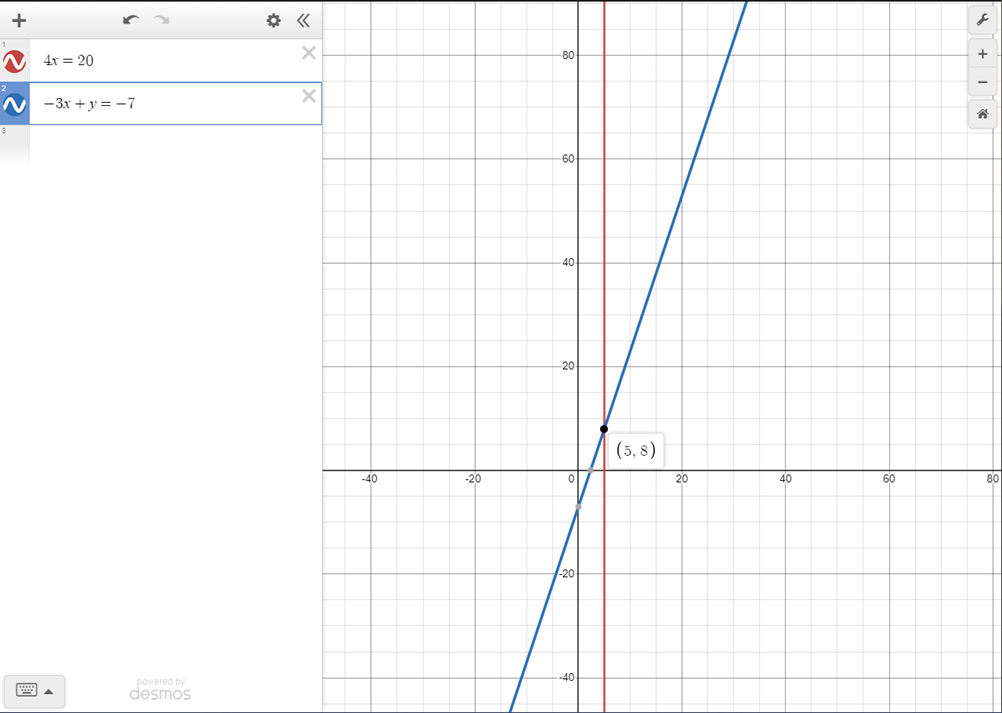
Two equations. One shared solution.

Enter both equations on separate rows. You do not need to rearrange them into y = mx + b. Select their intersection to read the solution.

4x=20-3x+y=-7
Read the coordinates
The graphs meet at (5, 8). That means x = 5 and y = 8.
Answer the actual question
If asked for x + y, enter 13—not 5, 8, or the ordered pair.

Check: 4(5) = 20 and −3(5) + 8 = −7. Adjust the window if the intersection is off-screen; never estimate coordinates from the picture.

Pick the move that fits the problem

Open a method for inputs, steps, and traps.
Graph both sides of an equation

Use this when isolating the variable would require several distributions, fractions, radicals, or nested expressions.

  1. Enter the left side as one graph, using y as the output.
  2. Enter the right side as a second graph.
  3. Select the intersection and read only the coordinate the question asks for.
y=3x+5y=2x+17

The intersection is (12, 41), so the equation is true when x = 12. The y-coordinate is only a shared output and is not the requested answer.

Watch out: Do not report the full intersection automatically. SAT questions often ask for x, y, x + y, or a coefficient instead.

Read roots from x-intercepts

Use this for quadratic, cubic, absolute-value, or other equations written as an expression equal to zero.

  1. Move every term to one side if the equation is not already equal to zero.
  2. Graph the resulting expression as y = that expression.
  3. Select every visible x-intercept and apply any domain condition from the question.
y=x^2-7x+10

The x-intercepts are (2, 0) and (5, 0), so the equation has solutions x = 2 and x = 5.

For y = x² − 7x + 10, the y-intercept is 10. The minimum is −2.25 at x = 3.5, which follows from y = (x − 3.5)² − 2.25. Select the turning point to read it; the minimum is the y-value, not the x-value.

Watch out: A graphing window can hide a root. Zoom out or set the x-axis bounds when the problem suggests large values.

Solve systems in their original form

Use this when two equations share x and y, especially when elimination would create awkward arithmetic.

  1. Enter both equations exactly as written. You do not need to solve each one for y first.
  2. Select the intersection point.
  3. Substitute the coordinates mentally into the simpler equation as a quick check.
2x+3y=19x-y=2

The lines meet at (5, 3). If the problem asks for x + y, calculate 5 + 3 rather than entering 5.

Watch out: Parallel lines have no solution, while the same line entered twice represents infinitely many solutions. Do not invent an intersection.

See systems of inequalities as regions

Use this for feasible regions, boundary questions, and answer choices that give ordered pairs.

  1. Enter each inequality with its original strict or inclusive symbol.
  2. Locate the region where all shading overlaps.
  3. Test a choice by plotting its point or substituting its coordinates into the inequalities.
y>=-2x+7y<x+1(3,2)

A solid boundary means equality is included. A dotted boundary means points on that line are excluded.

Watch out: A point can satisfy one inequality and fail the system. Check every condition, including whether the boundary is strict.

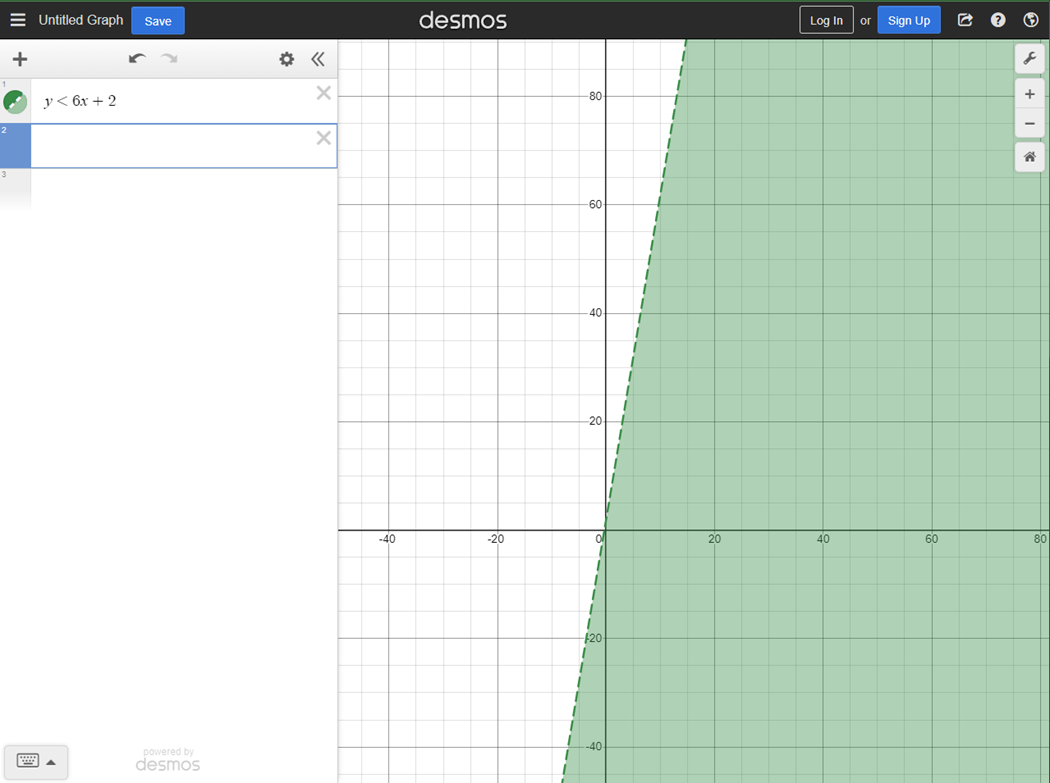
Another worked example in Desmos

Desmos shades the solution region for y < 6x + 2 with a dashed boundary.

The shaded side contains points satisfying y < 6x + 2. For example, (0, 0) works because 0 < 2. The dashed boundary is excluded: (0, 2) does not work. For a system, a point must satisfy every inequality.

Restrict a graph to the real context

Use this when time, length, population, or another variable has a stated domain and the unrestricted graph creates extra answers.

  1. Graph the model normally.
  2. Add the allowed input interval in curly braces at the end.
  3. Read intersections only from the visible, context-valid segment.
y=18+2.5x{0<=x<=12}

Only the portion from x = 0 through x = 12 belongs to the situation. Desmos hides values outside that interval.

Domain means allowed inputs; range means resulting outputs. For this rental, 0 ≤ x ≤ 12 produces 18 ≤ y ≤ 48. Curly braces restrict the display; they do not turn continuous values into whole numbers.

Watch out: A mathematically valid negative time or fractional person is still invalid in context. The calculator does not interpret units for you.

Define a function once, then reuse it

Use this when one formula must be evaluated at several inputs or compared with a target value.

  1. Define the rule with function notation.
  2. Evaluate a single input with f(value), or use a list for several inputs.
  3. For a target output, graph y = f(x) and the horizontal target line.
f(x)=0.08x^2-1.6x+24f(7)f([0,5,10,15])

The single evaluation answers one substitution. The list creates four outputs at once without retyping the formula.

Watch out: Keep parentheses around negative inputs. f(-3) and -f(3) are not generally the same.

Use sliders to expose a parameter

Use this to understand vertex form, exponential bases, line slopes, and questions asking how a parameter changes a graph.

  1. Enter a model containing an undefined letter such as a, h, or k.
  2. Create the slider when Desmos offers it.
  3. Move one parameter at a time, then use algebra for the exact final value if the slider only gives an estimate.
y=a(x-3)^2+2y=10

The vertex stays at (3, 2) while a changes the opening direction and width. The intersections with y = 10 move accordingly.

Watch out: A slider is excellent for structure and estimation, but dragging is not an exact solution method. Verify a final parameter algebraically or by direct substitution.

Fit the model the question names

Use this when a table is paired with a line, quadratic, or exponential model and the question asks for a best-fit coefficient or prediction.

  1. Enter the x and y data in a table so the columns are x₁ and y₁.
  2. On a new line, type the model with a tilde.
  3. Read the fitted parameters, then substitute only the value the question requests.

Use + → Table first and enter the paired data. The headings x₁ and y₁ supply the lists for the regression below.

y_1~mx_1+by_1~ax_1^2+bx_1+cy_1~a(b)^(x_1)

Desmos estimates m and b for the linear model, or a, b, and c for the quadratic model. Choose the family named or justified by the problem.

Watch out: Regression produces an estimate. Do not round a parameter before using it in a later calculation unless the question tells you to.

Compute list statistics directly

Use this for mean, median, total, spread, and the effect of changing or adding a data value.

  1. Put the data in square brackets and store it as a list if you will reuse it.
  2. Apply the needed function to the list.
  3. For a changed data set, edit the list once and compare the updated result.
L=[4,7,7,9,13]mean(L)median(L)total(L)

The list has mean 8, median 7, and total 40. These outputs stay linked if any entry changes.

Watch out: The median requires an ordered position, but Desmos handles the ordering internally. Your interpretation still has to match the question.

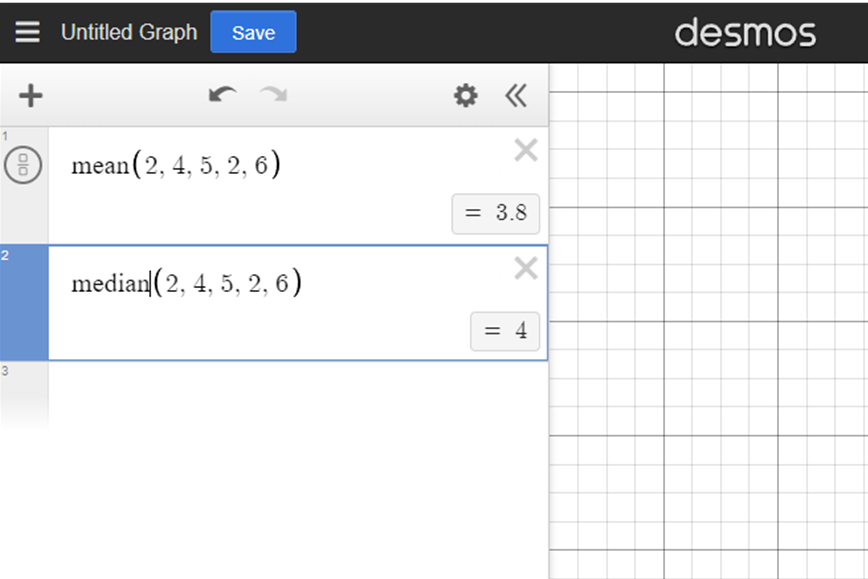
Another worked example in Desmos

Desmos calculates the mean of 2, 4, 5, 2, 6 as 3.8 and the median as 4.

For 2, 4, 5, 2, 6, the total is 19, so the mean is 19 ÷ 5 = 3.8. Sorted values are 2, 2, 4, 5, 6: the middle value, and therefore the median, is 4. Keep repeated values in the data.

Graph circles without solving for y

Use this for circle equations, line-circle intersections, tangency, and coordinate-geometry questions.

  1. Enter the circle equation in standard or expanded form exactly as given.
  2. Enter the line or second circle on another expression row.
  3. Select each intersection and apply the requested coordinate condition.
(x-2)^2+(y+1)^2=25y=2

The circle has center (2, -1) and radius 5. The line y = 2 meets it at (-2, 2) and (6, 2).

Watch out: In (x - h)² + (y - k)² = r², the center signs are opposite what appears inside each parenthesis.

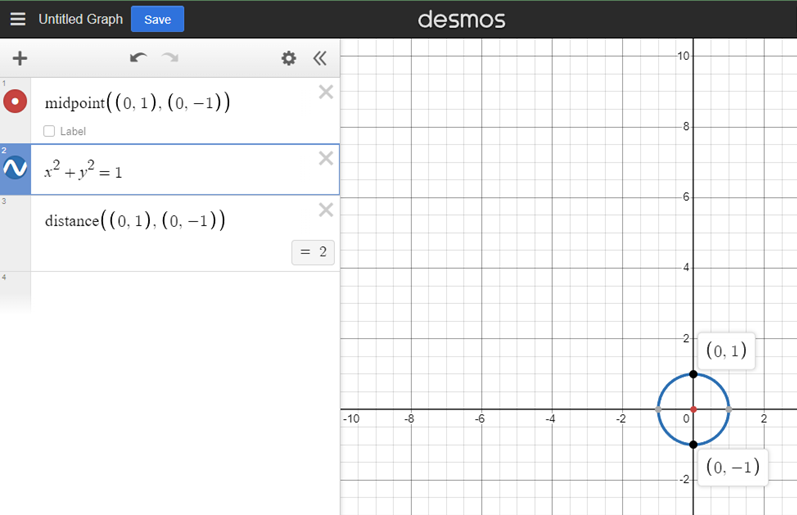
Another worked example in Desmos

Desmos shows the unit circle x² + y² = 1, its endpoints (0, 1) and (0, −1), their midpoint, and distance 2.

The circle x² + y² = 1 has center (0, 0) and radius 1. The marked points (0, 1) and (0, −1) are opposite ends of a diameter. Their midpoint is the center, and their distance is 2—not the radius.

Calculate percent changes with multipliers

A 20% increase multiplies by 1.20. A subsequent 20% decrease multiplies the new amount by 0.80, not the original amount.

100(1.20)(0.80)

The result is 96: a net 4% decrease. For repeated growth, use a power, such as 100(1.05)^3 for three successive 5% increases.

Watch out: Identify the base for each percentage. Equal increases and decreases do not cancel when their bases differ.

Before you submit

Read the requested coordinate or quantity. Check units, valid inputs, strict inequality boundaries, and any whole-number condition. Keep full precision until the final rounding step. For trigonometry, match degree or radian mode to the problem. Sliders help you explore; dragging one is not an exact proof.

Original TaroPrep explanations. Features checked against College Board policy and Desmos documentation. Screenshots show the general Desmos interface; practice in the College Board version or Bluebook preview.

Clear answers

Questions students ask before they begin

Get the rules straight, then spend your energy on the work that changes your score.

How long is the Digital SAT?

Testing time is 2 hours 14 minutes: 64 minutes for Reading and Writing, a 10-minute break, and 70 minutes for Math.

Can I use a calculator on every Math question?

Yes. Calculator use is allowed throughout Digital SAT Math. Bluebook includes Desmos graphing and scientific options. Use the Desmos section of this guide to learn intersections, roots, tables, regression, statistics, and calculator checks. Approved non-CAS handheld calculators may also be used under College Board rules.

Where do TaroPrep questions come from?

TaroPrep writes original SAT-style questions and maps each one to a tested skill, difficulty level, explanation, and review workflow.

Your next move

Know the route. Then make every practice minute count.

Start with a diagnostic, find the domains holding back your score, and let TaroPrep turn the result into a clear week.

Start your SAT diagnostic